
Search published articles
Volume 5, Issue 1 (9-2011)
Desiccation cracking commonly occurring in compacted clayey soils typically used as landfill liners can result in poor hydraulic performance of the liner. In this research, a simplified image processing technique was developed in order to characterize desiccation cracking intensity in compacted clayey soils. Three pairs of compacted clayey soils were studied in a relatively large scale experiment to evaluate the effect of geotextile cover on desiccation cracking under real-time atmospheric conditions. Digital images were taken from the surface of soils at certain time intervals for 10 months and were analyzed to determine crack intensity factor (CIF). The key parameter in identification of cracks as accurately as possible was found to be sensitivity. Calibration process was based on using %20 of the images with different crack intensities whose crack dimensions and therefore CIF values have been already measured to compare to program output. A calibration coefficient for sensitivity was accordingly determined based on the average difference between the sensitivity introduced by the program and the actual sensitivity calculated based on an overlaying process. Result of verification of this methodology indicated that it can be reliably used to determine CIF of compacted clay soils in a simple yet accurate manner.
Volume 9, Issue 1 (6-2015)
The Dynamic Probing is an important test in site investigation and geotechnical studies. It is used for determination of situation and specification of soil layers when the depth of exploration is moderate. In our country, in the last few years test has been widely used to replace the standard penetration. In this paper, the experiences to use different various types of dynamic probing rigs and the errors that can occur in these experiments are discussed. Then the accuracy of this test is studied to evaluate the specification of fine-grained soils. The most important innovation of this research is the proposition of the new correlations between cone dynamic resistance and undrained shear strength and so compaction percentage in fine-grained soils. The paper encourages the wider application and further development of this test for site investigation in fine-grained soils.
Volume 11, Issue 1 (Vol. 11, No. 1 Spring 2017 2017)
./files/site1/files/3Extended_Abstract.pdfExtended Abstract
(Paper pages 51-72)
Introduction
Value engineering is considered an efficient alternative to improve design and construction process of urban tunneling projects. Application of value engineering techniques can provide investigating all aspects of a project in a team work, creative and short-time manner which contribute to precisely identify a project’s quality improvement issues, construction time and costs.
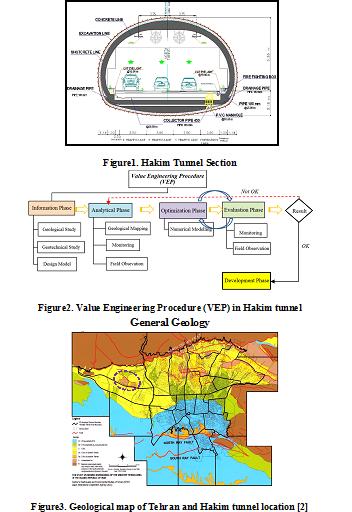
Hakim Expressway one of the capital's main highways in Tehran metropolis with 9 Km in length, starts from the junction of Resalat expressway and Kurdistan expressway after Resalat tunnel and ends in Lashgari expressway. The west extended this highway passing through the area of Chitgar forest park. Due to environmental constraints, the Hakim twin tunnels with cross-section of 186 m2 excavation areas and total length of 3256 m to the NATM/SEM method in this area were excavated (Figure 1).
In preliminary design of Hakim tunnel project, on category of excavation and support system was suggested. During the tunnel’s excavation operation, the behavior and classification of the tunnel were investigated from field observation, instrumentation and monitoring of geological models and subsequently, further excavation process was modified in accordance with value engineering. The aim of using value engineering approach in this project was to reduce the costs without any decrease in quality, employer satisfaction along with minimum risk and as well as improving operational and practical aspects. Ultimately, establishment of the value engineering approach on Hakim tunneling project leads to 10% reduction in construction costs as well as relevant quality with the least challenges (Figure 2).
General Geology
The city of Tehran is founded on Quaternary alluvium, which has been geologically classified by Rieben [1]. The city is located at the foot of the Alborz mountain range, which is basically composed of Eocene pyroclastic deposits (green tuff) and other volcanic rocks. The geology and the morphology of the Tehran region is similar to that for other cities located at the foot of mountains.
Rieben (1966) divided the Tehran coarse-grained alluvia into four categories, identified as A, B, C and D, where A is the oldest and D the youngest (Figure 3).
Hakim tunnel project locates on foothills of northern Tehran, crossing the hills of Chitgar forest park. Results of field surveys indicate that alluvial deposits in tunnel track belong to C (ramps and tunnel portal) and A formations (in most parts of tunnel track).
Geotechnical characterization
Table1 summarizes soil input parameters. Two soil types were considered for the model with 8- meter-height overburden. First layer (No.1) starts from surface with a 1 meter thickness. Second layer (No. 2) has 7 meter thickness.
Table1. Summary of the geotechnical parameters
| Parameter | Unit | Layer No. 1 | Layer No. 1 |
| Internal friction angle (CU) | Deg. | 29 | 33 |
| Cohesion (CU) | Kg/cm2 | 0.15 | 0.45 |
| Density | Kg/cm3 | 18.5 | 20 |
| Poisson ratio of unloading/reloading | Kg/cm2 | 0.2 | 0.2 |
| Secant deformation modulus | Kg/cm2 | 550 | 900 |
| Power of stress level of stiffness | 0.5 | 0.5 | |
| Stiffness unloading | Kg/cm2 | 1650 | 2700 |
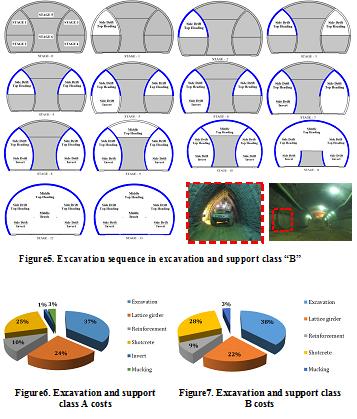
Detailed analysis before excavation and continuation of studies led to two excavation and support classes purposed for Hakim tunnel. Both classes of excavation and support due to ground conditions are modeled and analyzed using software Plaxis. For verification, the results of numerical analysis using monitoring and field observations were compared during the tunnel excavation. The results of monitoring compliance with the results of numerical analysis were appropriate.
Implementation and construction costs were calculated for different sections of two excavation and support classes in accordance to contraction documents to evaluate the effect of optimization in design (Figures 6, 7)
.jpg)
Figure4. Excavation sequence in excavation and support class “A”
Results
Results indicate that in both classes maximum costs are related to excavation section while minimum costs are for invert and mucking. In all concrete spray operations there was just a %3.5 increase in costs. Overall savings in excavation and support was about %10 which is significant (Figure 8).

Figure8. Savings percentage comparison in excavation and support classes A and B
Volume 11, Issue 4 (Vol. 11, No. 4 Winter 1018 2018)
Introduction
Recently, several studies on buried pipelines have been conducted to determine their uplift behavior as a function of burial depth, type of soil, and degree of compaction, using mathematical, numerical and experimental modeling.
One of the geosynthetics applications is the construction of a reinforced soil foundation to increase the bearing capacity of shallow spread footings. Recently, a new reinforcement element to improve the bearing capacity of soils has been introduced and numerically studied by Hatef et al. The main idea behind the new system is adding anchors to ordinary geogrid. This system has been named as Grid-Anchor (it is not a trade name yet). In this system, a foundation that is supported by the soil reinforced with Grid-Anchor is used; the anchors are made from 10×10×10 mm cubic elements. The obtained results indicate that the Grid-Anchor system of reinforcing can increase the bearing capacity 2.74 times greater than that for ordinary geogrid and 4.43 times greater than for non-reinforced sand...../files/site1/files/0Extended_Abstract6.pdf
Volume 12, Issue 5 (English article specials 2019)
Volume 13, Issue 2 (Vol. 13, No. 2 2019)
Introduction
This work intends to apply ASTER images to discriminate hydrothermal alteration zones in Kerman Cenozoiic Magmatic Belt (KCMB). Band ratio, principal component analysis, Crosta and color composite images are important methods to analyze satellite images. Previous researches showed that these techniques are not able to discriminate hydrothermal alteration zones and they usually detect vegetation covering as alteration zones. The reason is found in the spectral signature of vegetation and alteration minerals. It means that they present the same interaction when face with electromagnetic energy in different wavelengths. Hydroxyl-bearing minerals are the important products of hydrothermal alteration. Clays, which contain Al-OH- and Mg-OH-bearing minerals and hydroxides in alteration zones, are distinguished by absorption bands in the 2.1–2.4 µm range of ASTER data. Solving these problems is difficult when using standard image-processing techniques such as band rationing, principal component analysis, or spectral angle mapper. In recent years, several attempts were made to extract altered regions in the areas covered with vegetation. To overcome this problem, this research uses ASTER data by applying support vector machine (SVM) algorithmn. SVM is a new technique for data classification in remote sensing application. This paper aims to investigate the potential of SVM algorithm in mapping of hydrothermally altered areas. In many applications, SVM has been shown to provide higher performance than traditional learning machines and has been introduced as powerful tools for solving classification problems. The adopted dataset contains three ASTER scenes using SWIR and VNIR bands, covering the Meiduk porphyry copper deposit, Kader, Abdar and Iju occurrences located in Kerman Province, southeast Iran.
Material and methods
This work has been prepared on three ASTER level 1B scenes. Two scenes were acquired on 18th April 2000 and another scenes on 15th June 2007. These scenes were georeferenced by using an orthorectified ETM + image, in UTM projection and WGS-84 ellipsoid as a datum. The first two data sets were corrected for Crosstalk. Atmospheric corrections were also performed by using Fast Line of Sight Atmospheric Analysis of Spectral Hypercubes (FLAASH). The data sets were then mosaicked. Internal Average Relative Reflectance (IARR) correction was also applied. In this part, the training and test samples of the ASTER data are presented. The adopted image is a multispectral satellite image that contains 2204 training pixels which 516 pixels are related to arjillic zone, 1278 pixels are related to phyllic zone and 500 pixels are pertinent to propylitic zone (Fig. 1).
Fig. 1. Training pixels for learning SVM algorithm; Red pixels: arjillic; Green pixels: phyllic; Blue pixels: propylitic
Results and discussion
ASTER bands 4, 6, 7 and 8 were applied for determination of phyllic and arjilic zones and 9 bands of ASTER for propylitic alteration. In order to evaluate the developed algorirhm, confusion matrix was used and validation showed that discrimination of phylic and arjilic is not possible but propylitic zone could be identified by SVM. Also, the present research introduced a new error function, so called blind error, which is calculated using confusion matrix. Based on blind error, SVM did not classify 73.6 percent of the alteration pixels. But the remained pixels were classified with accuracy of 66.06%. Honarmand et al. (2011) and Mojedifar et al. (2013) studied the field samples of the present study area. Their studies showed that sericitization is the most widespread form of hydrothermal alteration at the Iju, Serenu, Chahfiroozeh, Meiduk, Parkam, Kader and Abdar porphyry copper deposits. Two types of phyllic alteration could be found in the study area including ferric-iron-rich and iron-oxide poor phyllic alteration. ASTER images were also analyzed by band rationing and principal component analysis (PCA) in order to compare their results with the SVM classified image. A comparison of the field data with altered areas mapped by PCA reveals errors in the classified map. Vegetation cover and sedimentary rocks are enhanced, which are erroneously identified as areas of alteration. The band ratio approach yields similar errors to those produced by the PCA method. These problems are less evident in the classified image obtained by SVM. The qualitative assessment of the accuracy of these methods indicates that SVM algorithm could be a reliable technique for alteration mapping, provided that the nature of the training areas is well known.
Conclusion
A comparison of the results obtained from traditional classification methods and support vector machine algorithm was performed in order to map hydrothermal alteration. Since the known occurrence of mineralization in the study area is consistent with the mapped distribution of hydrothermal alteration using SVM, this method is suggested to apply in exploring for hydrothermal alteration in other parts of the Iranian Cenozoic magmatic belt../files/site1/files/132/6Extended_Abstracts.pdf
Volume 13, Issue 4 (Vol. 13, No. 4 2020)
Introduction
Estimation of Liquefaction is one of the main objectives in geotechnical engineering. For this purpose, several numerical and experimental methods have been proposed. An important stage to predict the liquefaction is the prediction of excess pore water pressure at a given point. In general, there are two important methods for soil dynamics analyses, fully coupled effective stress and uncoupled total stress analysis. The main purpose of this study is to evaluate the model capacity of the finite difference software, FLAC, based on effective stress analysis methods to predict the excess pore water pressure during seismic loading. A level ground centrifuge test conducted during the VELACS project on the Nevada sand with a density of 40%, was utilized to calibrate the numerical model. After the validation of the numerical model, a model was conducted to predict excess pore pressure and consequently the liquefaction for the site of Bandar Abbas Mosque.
Theoretical bases
A fully coupled u–P formulation, where pore pressures and displacements are computed simultaneously and interactively at each time step, is used in FLAC software. This feature is used to simulate the excess pore water pressure time histories during cyclic loading.
The finite difference based software, FLAC, used the Finn model that incorporates two equations correlating the volumetric strain induced by the cyclic shear strain and excess pore water pressure produced during cyclic loading. As mentioned above, the pore water pressure generation can be computed from two sets of equations: Martin et al. (1975) and the Byrne (1991) formulations in which the volumetric strain that was produced in any cycle of loading is depended on the shear strain that was formed during that cycle as well as the previously accumulated volumetric strain.
Modeling and Results
The VELACS model # 1 centrifuge test representing a level ground site constituted of the Nevada sand at 40% relative density has been numerically simulated in the current study to validate the numerical model. The centrifuge model contains a laminar box with slipping “rings” that allows differential horizontal displacements. This was simulated in the FLAC model by free-field boundary conditions which prevent reflection of the waves in the side walls. Figure 1 shows comparison of EPWP time histories ratio of numerical modeling and centrifuge test. Static analysis was carried out before dynamic analysis in order to find initial stress and strain state. At the next stage, the dynamic loads were applied at the base of the model and dynamic analysis was performed.
For numerical modeling the results of the general soil mechanics test on soil samples and standard penetration test performed on the site were used to calibrate the parameters and select the model constants.
Conclusion
The results of numerical modeling have been matched to experimental results of the centrifuge test using both Martin and Byrne formulations, except for the case of 5 m the numerical model has predicted lower excess pore water pressure values than the experimental values. This may be originated from the fundamental assumption of the Martin et al. (1975) EPWP theory, in which excess pore water pressure is directly related to the relevant volume changes. On the other hand, the Martin et al. (1975) model was adopted for one-dimensional measures of shear strain, while, in a 2D analysis under both horizontal and vertical shakings, there are three strain rate measures. FLAC uses some assumptions to solve this problem and it can affect the results.
The results of the numerical model showed liquefaction to a depth of about 5 meters that is almost compatible with the results from the lab, which has declared that the depth 2 to 5 m is liquefiable.
With careful selection of numerical model parameters one can generally use the simulation results to have a general sense on the pore water pressure generation and liquefaction prediction.
./files/site1/files/134/5.pdf
Volume 14, Issue 1 (5-2020)
Introduction
Studying the effect of slope angle on bearing capacity of foundations on the slope in urban areas is a challenging problem that has been investigated by researchers for years. In general, the analytical approaches for solving this problem can be categorized into limit equilibrium, characteristics and limit analysis methods. In recent years, there have been studies for using the limit analysis within the framework of finite element method for geomaterials. In these studies, the soil mass is not considered as rigid and there is no need to predefine a failure surface for the slope. In the performed research, using the upper bound finite element limit analysis, bearing capacity of strip foundation on slope have been studied. This analytical method enables the use of the advantages of both methods of limit analysis and finite element analysis. In this method, the slip between the two elements is considered. In order to find the critical state of the failure, the rate of power internally dissipated is linearly optimized, by using the interior points method. The advantages of this method are the high convergence rate in comparison with other analytical optimization methods. The effect of different upstream and downstream slopes and foundation depths and also the influence of various mesh discretizations have been evaluated. Finally, the results are compared with those obtained from previous methods available in the literature.
Methods
The finite element limit analysis method is based on nodal velocities. Considering the principals of the finite element method and having the nodal velocities, the velocity at each node of the element can be obtained from corresponding shape functions. The rate of power internally dissipated in each element is defined by multiplying the strain rate on stress in each element. In this method, the slip between the two elements and the rate of internal power dissipated at each discontinuity of two adjacent elements is considered. For this purpose, in each node, four new unknowns’ velocities are defined. To remove the stress from the equations, and provide a linear relationship for linear optimization, a linear approximation to the yield function has been used. For this purpose, the Mohr-Coulomb yield criterion is estimated with a polygon in the stress space. Also, using the reduced strength parameter, the effect of the dilation angle is considered. According to the principles of upper bound limit analysis, the value of plastic strain rate is calculated from the flow rule. The velocity field in elements and discontinuities must satisfy the set of constraints imposed by an associated flow rule. In order to have an acceptable kinematics field, the velocity vectors have to satisfy the boundary conditions. These conditions include zero kinematics velocities along the vertical and horizontal boundaries of the geometry as well as negative vertical unit velocities and zero horizontal velocities at points underneath the rigid foundation.
Results and discussion
In order to calculate the bearing capacity of foundation, a set of different uniform and non-uniform mesh has been examined. The results obtained from different uniform mesh sizes indicate a certain divergence in the course of analysis. However, the results between the fine and very fine non-uniform mesh are closely related to each other and are converged. The obtained results show that, by increasing the internal friction angle, the bearing capacity has been increased. At high angles of modified friction, the effect of increasing the internal friction angle on the increase in bearing capacity is more in slopes with lower angles. By increasing the downstream foundation depth, the bearing capacity has been increased. This increase is more important in the case of slopes with lower angles. However, the upstream depth variations didn't present a significant effete on bearing capacity. In order to investigate the effect of upstream angle on the bearing capacity, the upstream mesh is also refined similar to the downstream. The obtained results indicate that variations of the upstream angle have a minor effect on the bearing capacity. This is of course true if the upstream slope is fully stable. The results of the proposed method in this study are an upper bound for the results reported by the limit equilibrium and displacement finite element methods. As seen in Figure 1, the suggested method predicts lower bearing capacities compared to rigid block limit analysis method and is indeed a lower bound for the classical limit analysis method. The finite element limit analysis with linear optimization has resulted in more bearing capacity than cone optimization. The bearing capacities, obtained from characteristic lines method depending to the slope angles, in some cases is more and in some cases less than those explored by the proposed method.
In this paper, the bearing capacity of foundation located on slope was evaluated by finite element limit analysis method. In this regard, the effects of different downstream and upstream angles of slope and foundation depths and also, the effect of various mesh discretizations on the bearing capacity were studied. It is shown that an increase in the downstream angle causes a decrease in the bearing capacity and an increase in the downstream foundation depth leads to an increase in the bearing capacity. However, the upstream angle and upstream foundation depth were not much effective on the bearing capacity.
Volume 14, Issue 4 (1-2021)
Introduction
Excavation in urban areas occasionally is accompanied by the improper performance of the support system for even small deformations. In this regard, deformation control design based on force-based approaches provides a more realistic reprehensive of excavation performance. Top-down deep excavation techniques are among the modern excavation stabilization methods in urban areas. In this method, unlike the conventional methods, it is possible to perform the excavation and construction operations simultaneously. The present study aims to investigate excavation stabilization using the main structure through the top-down approach. For this purpose, field and numerical evaluations of the stabilized project were conducted based on the top-down approach in the downtown of Qom city, Iran. This research reports the information obtained through monitoring and modeling using the finite element ABAQUS software, predicting the occurred deformations until the end of excavation operations using the calibrated model, and offering an initial estimation of the required stiffness for the support system with respect to the lateral deformations in four sites proposed, according to the studies of Line A Qom Subway.
Project specifications
Based on the geological studies of Line A Qom Subway Tunnel, the geological layers are classified into four soil classes. Qc-1 consists of gravely sand with fine content of 5 to 20%; Qc-2 is silty and clayey sand with fine content of 35 to 60%; Qf-1 is clayey silt with fine content of 60%; and Qf-2 is a silty clay layer with fine content above 60%. Line A of Qom subway passes the study area of the present study, which is located in Ammar e Yaser Street (Station A6). Based on the geotechnical studies of the project site, the site in the levels near the ground consists of Qc-2 but in the lower elevations, it is composed of Qc-1 and Qf-2.
Salam Trade Complex, located in the downtown of Qom city, has 6 underground stories and 6 above-ground stories. It is limited to the main street in the south and to urban decay in the three other directions. The final excavation depth, length, and width is -21, 36, and 32-52 m, respectively. The project structure consists of a steel moment frame with a retaining wall in the negative elevations and metal deck frame for ceiling construction. In this project, excavation wall deformation was monitored in three important sections (A, B, and C). Due to the vicinity to urban decay, a total station TS02 was used for monitoring these sections. According to the field surveys, the maximum horizontal deformation of the walls in sections A, B, and C is 24.10, 42.16, and 47.21 mm, respectively, which were measured in the 0, -1.5, and 0 m elevations.
Monitoring process and numerical simulation
To calibrate the prepared model, a sensitivity analysis was performed on geotechnical parameters including modulus of elasticity (E), internal friction angle (φ), and cohesion (C) of the layers by simulating 60 numerical models. Based on the sensitivity analysis results, an increase in internal friction angle and elasticity modulus for layer 1 (i.e., φ1 and E1) and elasticity modulus of layer 3 (E3) results in a decrease in lateral deformation. Finally, using the sensitivity analysis results and after several trials and errors, the numerical models for sections B and C were calibrated when reaching the depths of -8 and -11 m, respectively. Using these models, then, it is possible to predict deformations up to the end of the project.
To determine the required stiffness for the excavation support system, regarding the acceptable deformation of the adjacent soil mass, 160 numerical models were built and their results were analyzed. Based on the results of Brason and Zapata (2012), relative stiffens (R) were used to develop a relationship between the maximum lateral deformation of the wall and the required stiffness of the support system. R is a dimensionless parameter that represents the stiffness of a solid support system; the greater this value is, the more flexible the system would be. In this study, caisson pile length, excavation width, and buried depth of the wall were used for determining the R.
R =
 (1)
(1)Figure 2 presents the maximum occurred deformation in terms of depth versus the relative stiffness for sites QC and QF.


Figure 2. Maximum deformation in terms of depth versus the relative stiffness for sites QC and QF
Conclusion
- According to the monitory data, the maximum lateral deformation in sections B and C until the end of the project was 42.16 and 47.2 mm, respectively. Moreover, the deformation of the other points inside the excavation was 30 mm.
- Considering the occurrence of maximum lateral deformations in the higher elevations in the monitored sections, it is inferred that excavation support at the ground level plays a key role in this approach. Hence, the lack of completing the structural frames and slabs for facilitating the excavation operation can lead to an increase in deformation levels.
- Based on the prepared graphs, the top-down approach in sites QC-2 and QF-2, compared to sites QF-1 and QC-1, provides a more desirable performance for deformation control.
Volume 14, Issue 4 (1-2021)
Introduction
Series A of coarse-grained alluvial deposits of Tehran are extended in eastern and north-eastern areas of Tehran. Analyzing and studying of these alluvial deposits from a geological point of view as well as their creation time and general characteristics such as the deposits’ mineral types, their source, and formation conditions, gives a better point of view to geotechnical engineers about exploring their characteristics as well as geotechnical aspects in underground structure design, excavations, and foundation design processes. On the other hand, in order to analyze stability, estimating the factor of safety and the seismic design of these structures, considering their location, which is in Tehran with a high seismic hazard area, the necessity of knowing the exact mechanical and dynamic properties of Tehran's alluvium is felt more than ever.
Material and methods
Due to the grain size of Tehran’s coarse-grained alluviums (series A) as well as high level of cementation of them, it is impossible (or maybe so difficult) to make undisturbed samples in order to do experiments. Such that it is excavated 23 boreholes with 30 to 140 meters depth as well as 17 test wells with 20 meters depth in an area which was extended in 10 kilometers in long which were located in Tehran’s No. 13 and No. 14 districts (as it can be seen in Figure 1). During the excavation of the entrance ramp and tunnel of eastern highway of Tehran, in-situ tests have been done in different sequences. Since it was important to investigate real behavior of these alluviums, different in-situ tests such as plate load test, in-situ shear test, pressuremeter test, and downhole test have been done as well as many laboratory and field tests. Furthermore, (1) X-Ray Diffraction (XRD) and (2) X-ray Fluorescence (XRF) as well as (3) Scanning Electron Microscopy (SEM) methods, have been used to explore the type of minerals and those used in cementation.
(ب)
Figure 1. a) Geological plan and the location of boreholes and test wells in the alignment of East Tehran Freeway
Results and discussion
Based on the results of XRD tests, it is quite clear that the largest weight percentages of tested samples are lime and silica.
Calcium and magnesium levels-as the high-power cations in flocculation process-in soil sample No. 1 (soil with high cementation level) are much more than soil sample No. 2 (soil with moderate cementation level).
This is the cause of high cementation level of soil sample No. 1 comparing with soils sample No. 2. A rapid increase in stress level can be seen in in-situ shear test results, in low shear displacements, up to reaching a maximum of τp (peak point) and afterwards reduction in shear stress with softening behavior.
Cohesion and shear strength levels also increase by increasing the depth. According to the plate load tests results, an increase in soil modules changes can be seen in different depths by depth increasing.
Large tendencies to increase in volume and dilation can be seen in under shear load cemented soils, after applying a primary compression on them. A brittle behavior with the occurrence of a certain peak can be seen in cemented samples. The significant increase in strength is directly related to the severe dilation rate, which can be seen in cemented samples results. The shear strength would be decreased, if this cement is broken during the particles’ displacements.
The results of downhole tests are shown in Figure 2. According to this figure, it has been explored that Vs,30 is about 600 m/s in moderate cemented soils while it is about 850 m/s in highly cemented soils. Because of the homogeneity and uniformity of sedimentary deposits, shear wave velocity is increasing due to the higher density of the layers and high level of cementation in both of the soil types. However, this increase is not significant at depths above 25 meters.
Conclusion
Based on the results, cementation level of the eastern coarse-grain-alluvium of Tehran is moderate to high and minerals used in cementation of this type of soil are generally carbonated and especially calcite.
Investigating the level of cementation of soil as well as the results of chemical analysis and in-situ tests, it can be found that the strength and deformation parameters of the soil are directly related to the degree of its cementation.
Based on the obtained results, the deformation modulus increases by about 25%, the cohesion by about 55% and the shear wave velocity by about 30% with increasing the degree of cementation (Table 1).
Increases of these parameters are directly related to depth. However, the cementation level does not significantly affect the internal friction angle of the soil.
Table 1. Average results of in-situ shear tests
| Deformation Modulus (MPa) | Peak Friction Angle (deg.) | Cohesion (kPa) |
USCS | Depth (m) |
Sample |
| 50-60 | 39 | 30-35 | GW-GM | 5 | Moderately Cemented Soil (M.C. Soil) |
| 75-85 | 41 | 50-60 | SP-SC | 10 | |
| 85-90 | 41 | 50-60 | GW-GC | 15 | |
| 95-105 | 41 | 50-60 | GW-GC | 20 | |
| 60-70 | 39 | 35-40 | GW-GM | 5 | Highly Cemented Soil (H.C. Soil) |
| 75-85 | 39 | 50-60 | GW-GC | 10 | |
| 110-120 | 42 | 65-75 | GW-GC | 15 | |
| 125-140 | 41 | 110-120 | GC | 20 |
Volume 15, Issue 3 (12-2021)
In current paper the effects of surface unreinforced / reinforced sand layers coupled with and without single and group sand columns on the bearing capacity – settlement behavior of soft clays has been investigated. In this regard behavior of soft clay, clay + unreinforced / reinforced sand layer, clay + single / group sand piles and clay + unreinforced / reinforced sand layer + single / group piles samples has been assessed. Geogrid was adopted as the reinforcement, a circular plate 5cm in diameter as the loading surface and C.B.R. apparatus as the loading system. Results show that employing unreinforced / reinforced sand layers at a settlement ratio of 5% improves bearing capacity by 4 t0 7 times the soft clay. Coupling the surface unreinforced / reinforced sand layers with single / group sand piles further increases the bearing capacity by 7 to 9 times that of soft clay.
./files/site1/files/%D8%B9%D8%A8%D8%AF%DB%8C.pdf
Volume 16, Issue 1 (5-2022)
The goal of this study was improvement of sandy soil using a combination of polystyrene foam container waste and Portland cement. For this purpose, Babolsar sand was used as the base soil. Strips of disposable polystyrene foam container waste in “chips” of 50 ´ 5 mm and 50 ´ 10 mm were added to the soil at 0.0%, 0.1%, 0.2% and 0.3% by weight along with 3% Portland cement at a relative density of 70%. All samples were cured for 7 days under saturated conditions and then tested using a large-scale direct shear apparatus. The results showed that, in both cemented and uncemented samples, the addition of foam chips increased the cohesion and internal friction angles, which increased the shear strength of the soil. At higher percentages and using larger-sized foam chips, the shear strength increased even more. In uncemented samples, the stiffness did not change with the addition of foam chips, yet the final dilation of the samples decreased. In cemented samples, both the stiffness and softening behavior after the peak strength point decreased. The final dilation of the cemented samples increased at higher foam chip contents and for the larger sized chips. The results of numerical analysis showed that the use of foam chips increased the safety factor of a slope improved in this manner. It also was found that the foam chips with a lower length-to-width ratio had a greater effect on increasing the safety factor of the tested slopes.
| Page 1 from 1 |
Related Websites
Site Keywords
نشریه, Academic Journal, Scientific Article, کلمه شماره یک, کلمه شماره یک, کلمه شماره یک, کلمه شماره یک, کلمه شماره دو, کلمه شماره یک, کلمه دوVote

© 2024 CC BY-NC 4.0 | Journal of Engineering Geology
Designed & Developed by : Yektaweb